STATISTICS with R
RStudio Environment
RStudio (developed by Posit company) is one of the most popular programming environments (integrated development environment or IDE in short) for the R statistical programming language which is available for download or use in the cloud. We learned how to download and install R and RStudio in Chapter 1 installing R and RStudio. In this section, we are going to explore the main parts and windows of the RStudio environment which are mostly used by data analysts and statisticians. These main windows are the most commonly used ones in daily life of a statistician.
RStudio Main Windows
When RStudio is open, there are three main window panels that are the most used areas during statistical analysis. We are going to learn more about these three main window panels, as designated with numbers 1, 2, and 3 in Figure 1 (RStudio for Windows 11 version; this interface may slightly be different on a different operating system.)
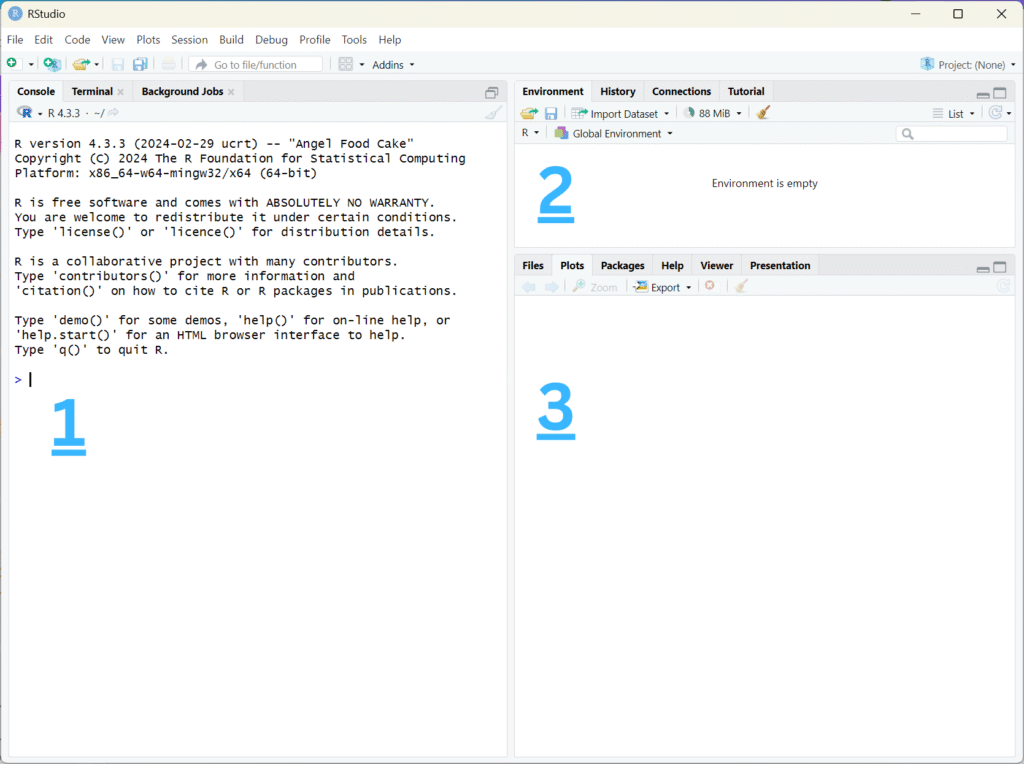
We describe the purpose of each of the numbered windows in the following sections.
1. Console
Window 1 shows the RStudio console window. When RStudio is opened, it automatically detects the R version installed and outputs in the console details about the version of R detected, such as the R version, the date it was released, and often a nick name for the version. The console window is the area where results of analyses are shown when an R script is run. In addition, the console area can be used to write R code, especially short R code lines after the main code is run. Most users write the R code in a script file (like a text file) so that they can save or share it. In addition, writing R code in a script is easier to edit and understand. Complete statistical analysis is rarely done in the console.
2. Environment
The environment (Window 2) includes information about the data imported into the RStudio program, the data and variables created during an R session, and objects created and stored in memory during the session. The Environment is like a dashboard that helps the user understand what data, variables, and objects are currently in use.
3. Plots
The plots window (Window 3) is where the graphical output of the R code is displayed. The plot window is used to display the results of the analysis in graphical form, such as histograms, scatter plots, box plots, and other types of plots. The plot window can show both static and interactive plots. In addition, it provides the option to copy to clipboard or save the plots.
Installing an R package in RStudio
When we install the R statistical programming language for the first time, a base version of the language together with a set of essential statistical and data manipulation functions are installed, such as functions to produce descriptive statistics or basic plots. Sometimes, we may need to perform more advanced statistical analysis or produce richer plots. In such cases, we can install additional prepackaged R functions called a package.
A package (or a library or a module) is a bundle of code that brings additional functionalities to the base R. A package may include code, data, and help documentation. Because R is an open-source programming language, packages are mostly written by independent statisticians and computing scientists. These R packages may be stored on the official R website (Comprehensive R Archive Network: CRAN) or the package authors’ GitHub page.
There are two main ways to install an R package: using the menu item Tools / Install Packages or by writing the command install.packages(“packageName”) in the R console. Figure 2 demonstrates the steps to install the popular plotting package ggplot2 using the RStudio menu.
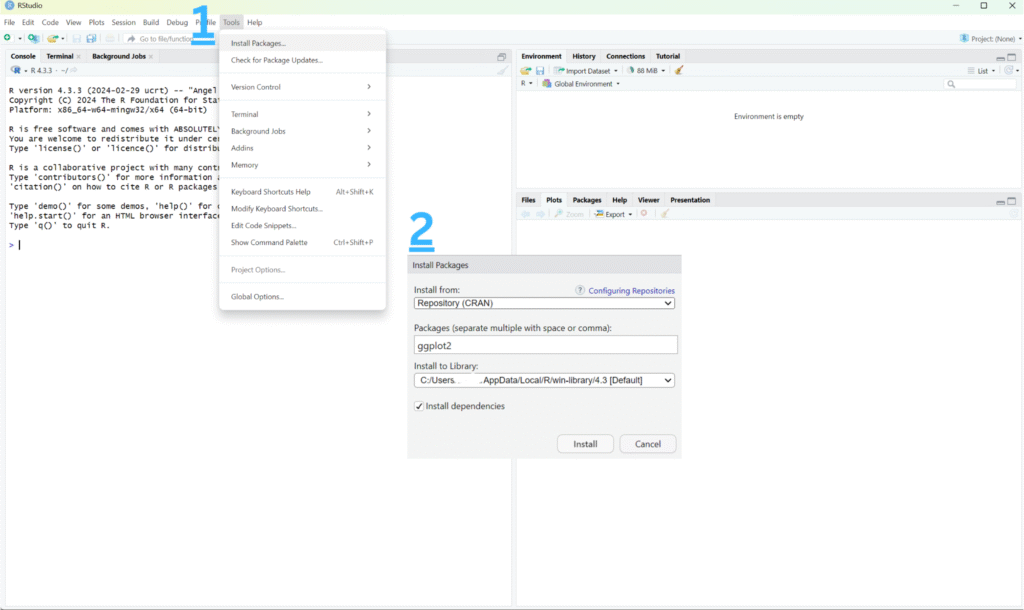
First, in the RStudio menu bar, click on Tools and then click on Install Packages …. The Install Packages window (shown by number 2 in Figure 2) will pop up with three text boxes, of which two are already filled out be default. In the middle text box, type the name of the package, e.g., ggplot2. We can leave the rest of the options as default. The first text box shows where the package is downloaded from (official CRAN, in this case), and the last box shows where it will be downloaded to. Make sure the Install dependencies option is checked (so that other packages this package depends on are also downloaded and installed). Click Install to install the package.
In the second method to install an R package, we type the command install.packages(“packageName”) in the R console. Make sure the name of the package is inside quotation marks. Figure 3 demonstrates that we are installing the “ggplot2” package using the console in RStudio.
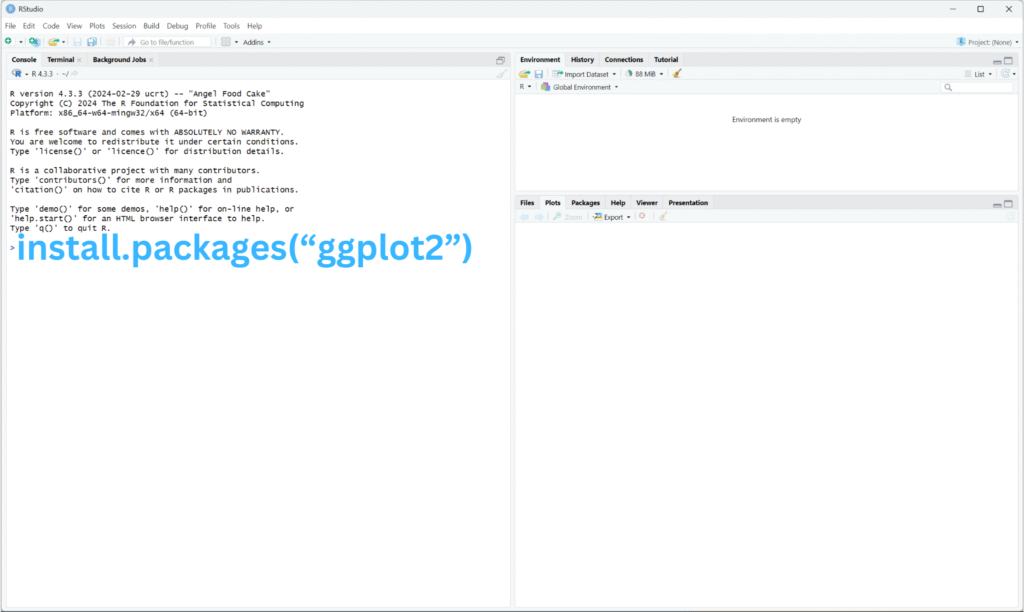
After typing the command install.packages(“ggplot2”), the package will be downloaded from the default web host (CRAN) and saved into our computer in the default path.